

Sustainability · Transport emissions
The CO2e emissions of every trip, calculated leg by leg
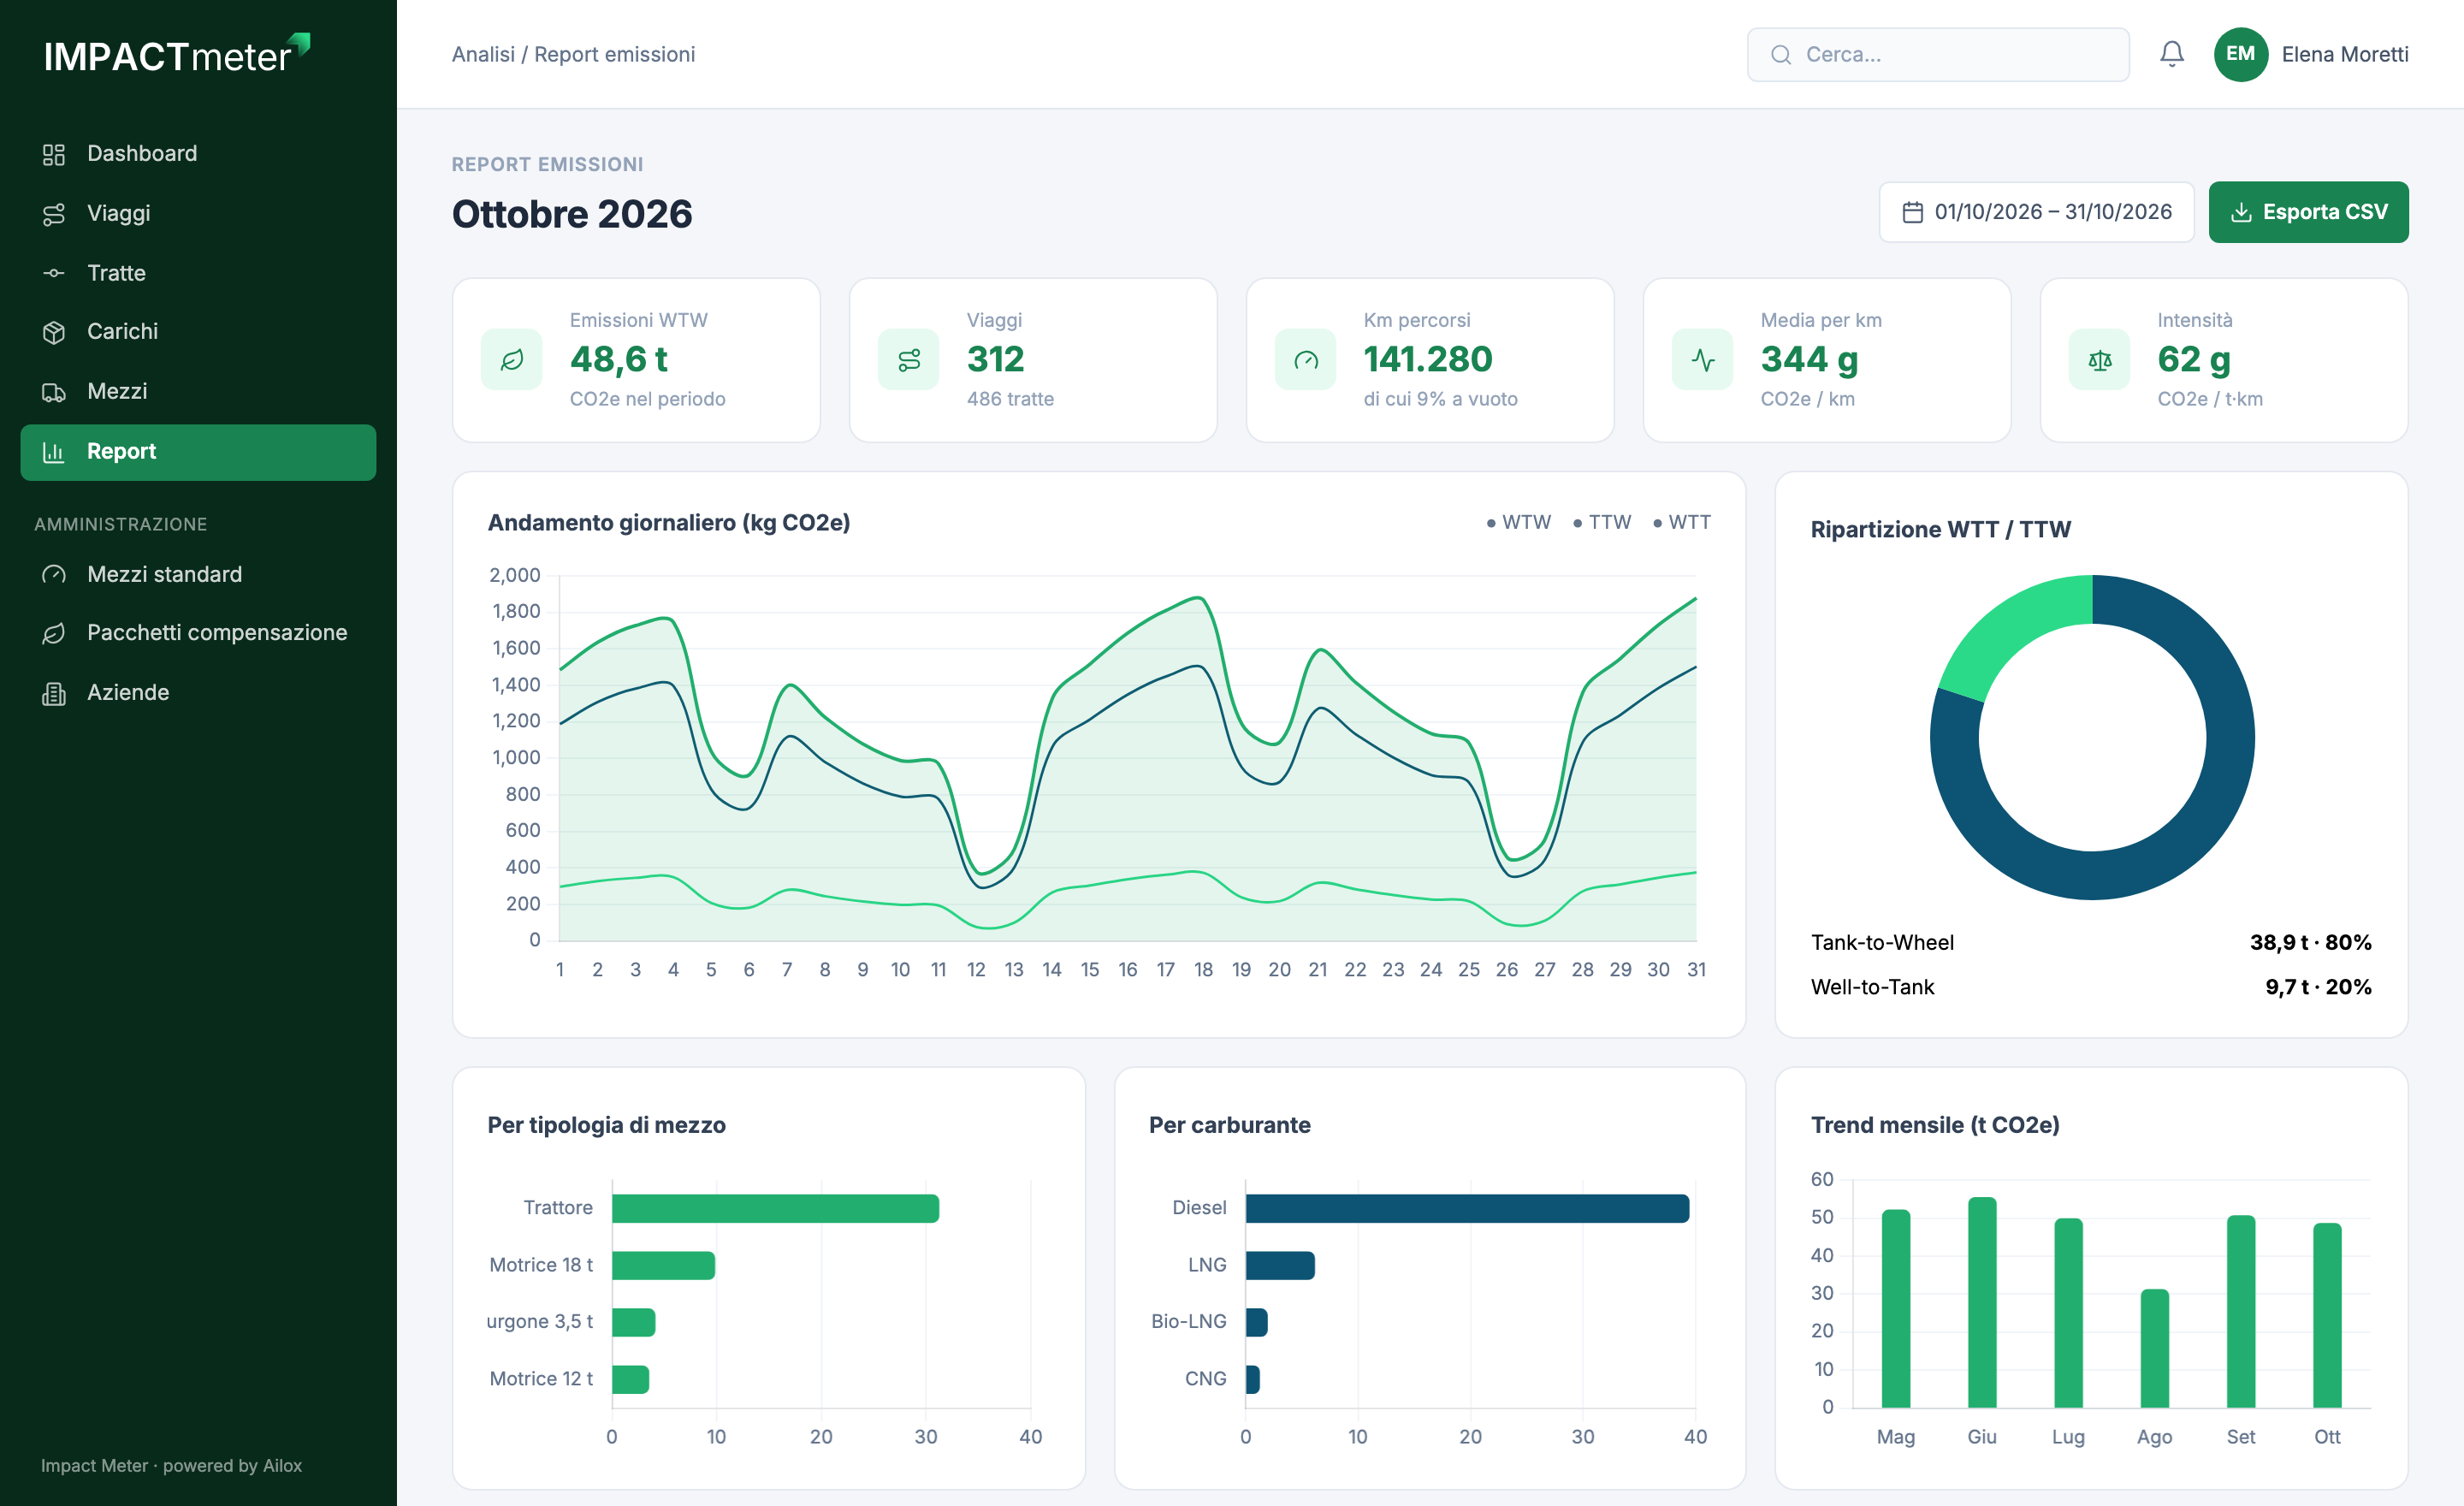
Impact Meter is the platform for transport and logistics companies that need to document freight emissions to customers, investors and funding calls. It derives emissions in kg of CO2e from trip data and gathers them in reports and charts.
- Product
- Impact Meter
- Sector
- Logistics and road freight
- Development
- Since 2024
- Access
- Company portal and public demo calculator
At a glance
- Well-to-Tank + Tank-to-Wheel
- WTW
- Well-to-Tank + Tank-to-Wheel
- per trip, leg and tonne-km
- kg CO2e
- per trip, leg and tonne-km
- fuels in the emission factor library
- 9
- fuels in the emission factor library
- to load trips from other systems
- API
- to load trips from other systems
The challenge
Emissions to report, data scattered everywhere
Customers, investors and funding calls increasingly ask for freight emissions. The data to calculate them exists, trips, kilometres, loads and vehicles, but it lives in different systems, and a spreadsheet cannot keep up with method, updated factors and per-trip reports.
The solution
A transparent calculation, trip by trip
Every trip is split into legs, with distance, freight, vehicle and load factor, including empty returns. The system calculates emissions with a methodology inspired by the GLEC Framework, sums them per trip and gathers them in reports and charts ready to share, also via API.
Methodology
A transparent calculation, inspired by the GLEC Framework
For each leg, Impact Meter multiplies distance, freight weight, load factor and the vehicle’s emission factor. The load factor tells full legs from empty ones, and every vehicle has its own factors per fuel.
The result is expressed Well-to-Wheel, split into Well-to-Tank (fuel production and distribution) and Tank-to-Wheel (combustion). The calculation currently covers road transport.
Emissions of one leg
WTT
Well-to-Tank
fuel production
TTW
Tank-to-Wheel
combustion
WTW
Well-to-Wheel
total
How it works
From trip to report
01Trip and legs
Addresses with autocomplete and calculated distance, one or more legs per trip.
02Loads and vehicle
Freight weight, fleet or standard vehicle, empty leg.
03Calculation
WTT, TTW and WTW emissions recalculated on every save, then summed per trip.
04Analysis
Indicators and charts by period, vehicle and fuel.
05Report
Printable or PDF trip report, with a route map.
06Sharing
CSV and Excel export and APIs for company systems.
The detail
Every leg, its own footprint
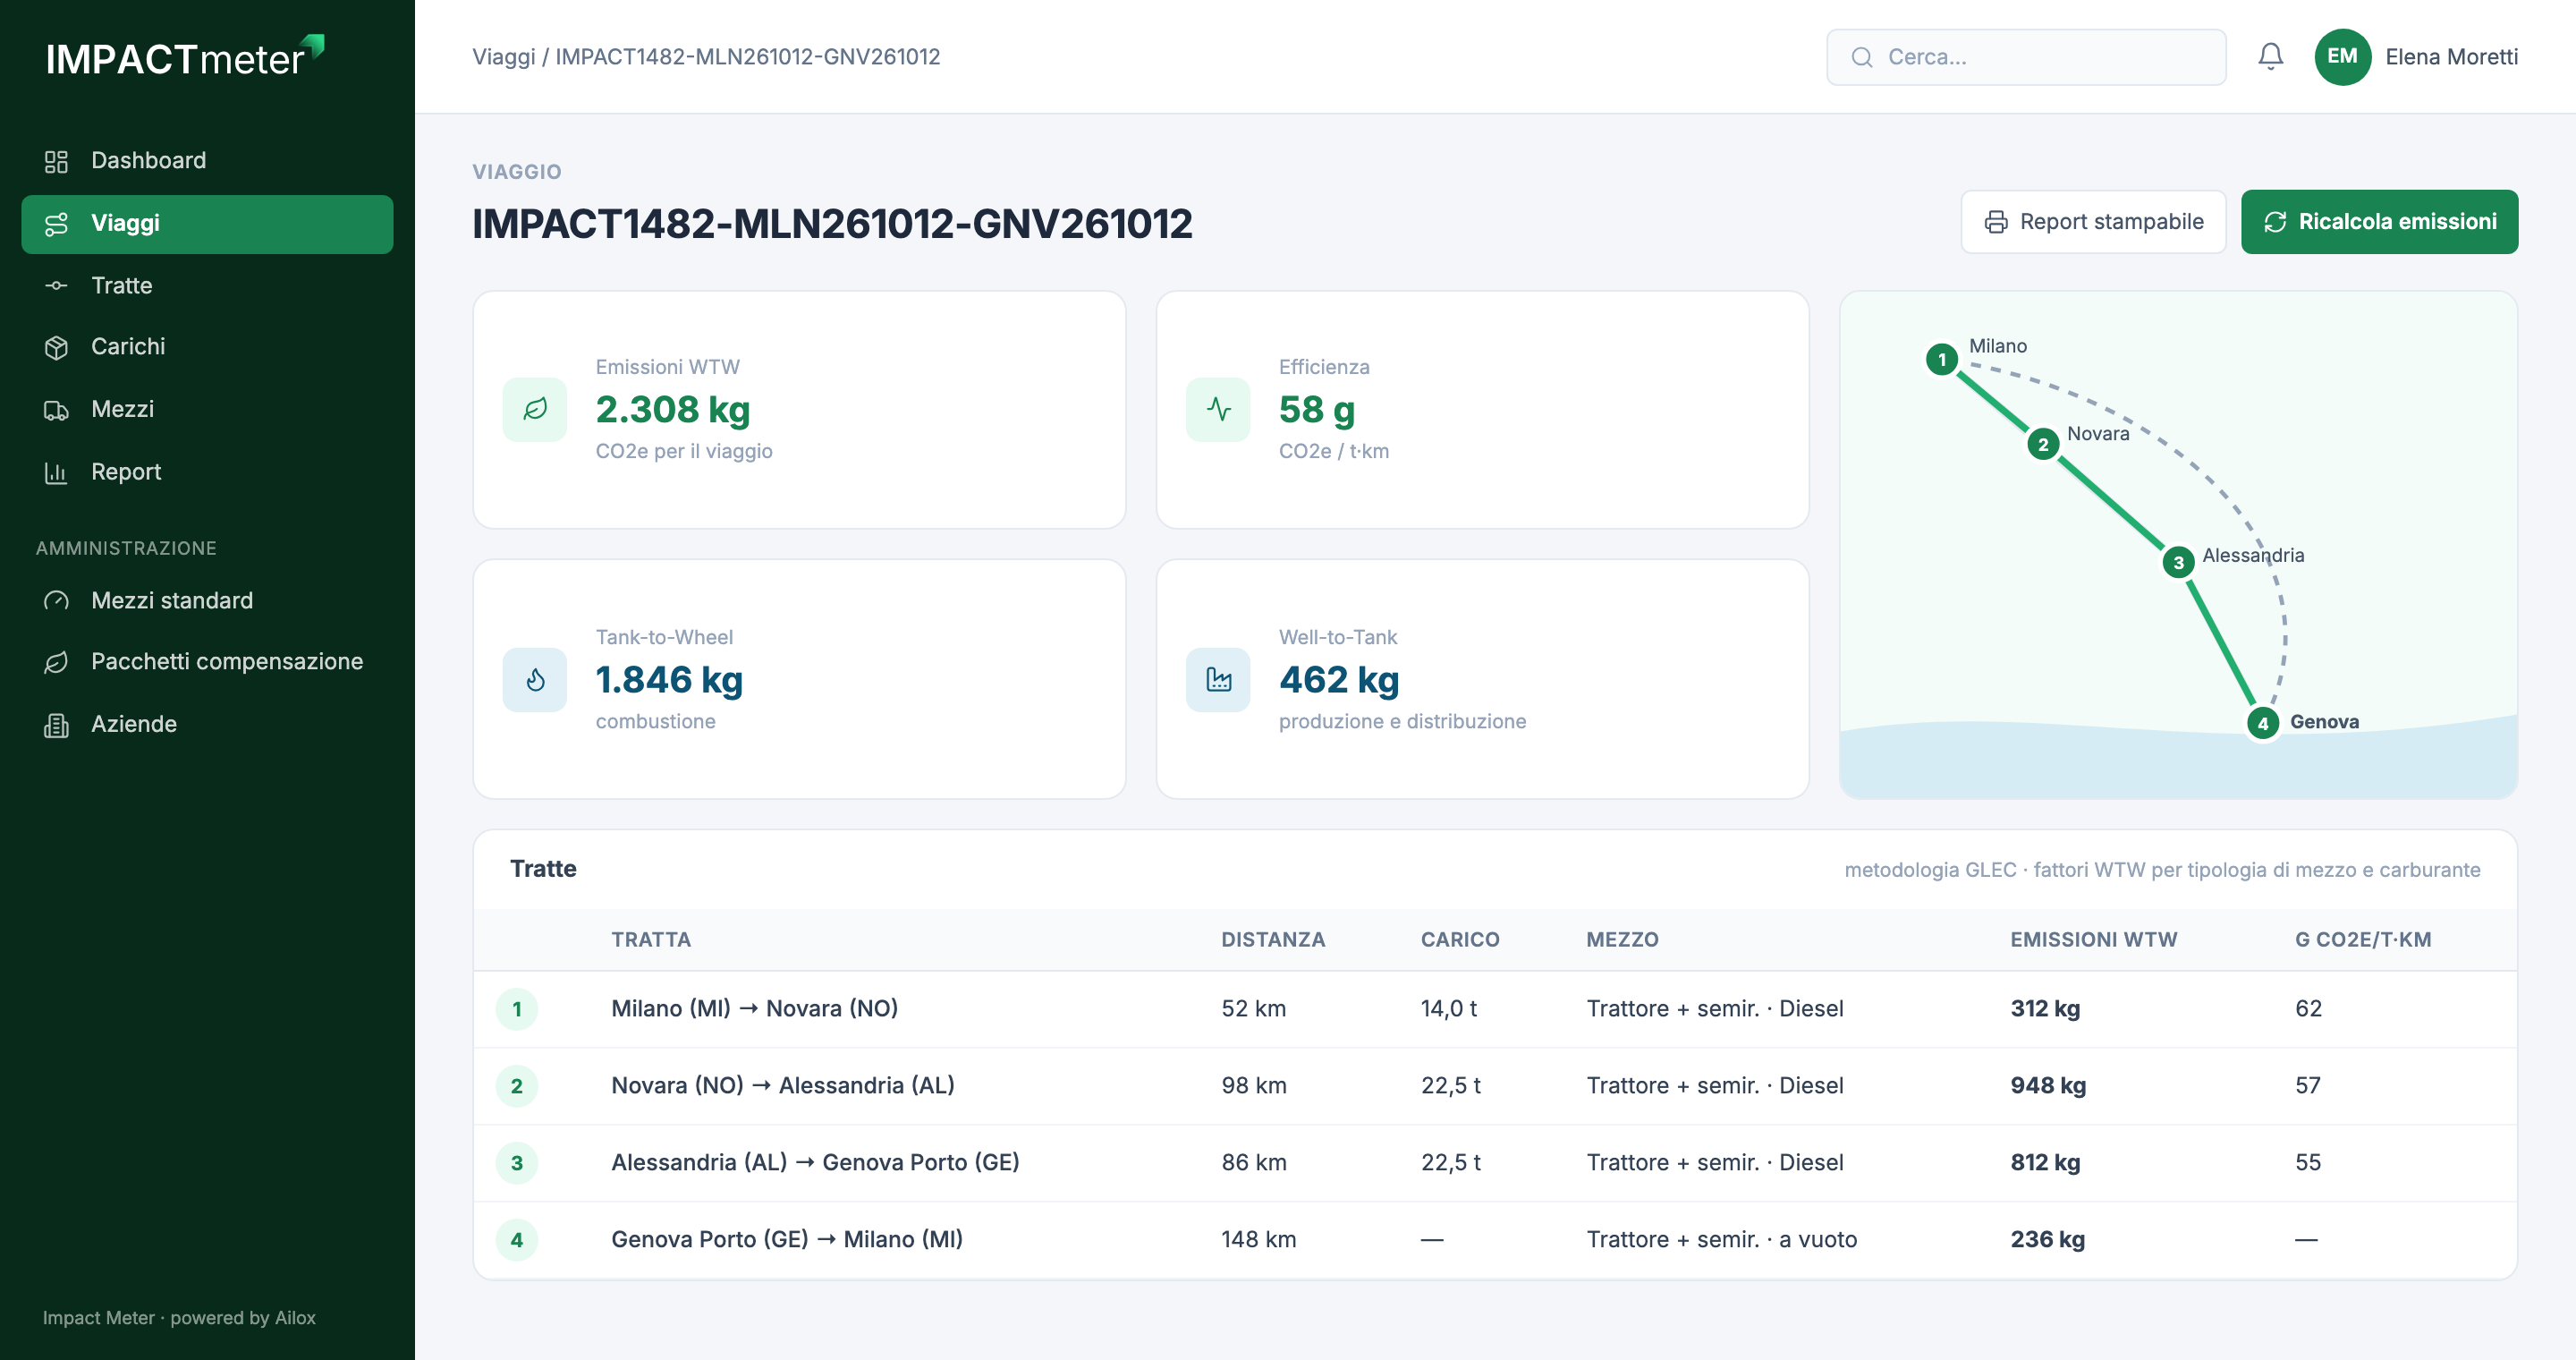
The trip detail shows the emissions of every leg, the vehicle used and the intensity in grams of CO2e per tonne-kilometre. Empty returns are counted too, with their own load factor.
Features
What the platform does
- Trips, legs and loads
- Each trip with multiple legs and loads, bulk or containerised, with an automatic reference code.
- Factor library
- Standard vehicles with fuel, average and empty load factors, WTT and TTW factors in g CO2e/t·km.
- Company fleet
- Real vehicles with plate and driver, linked to a standard vehicle type.
- Automatic distances
- Route and kilometres calculated from the addresses.
- Analytics report
- Total emissions, trips, km, average per km, trend over time, split by vehicle and fuel.
- Trip report
- Total emissions, efficiency in kg CO2e/t·km, per-leg chart and route map.
- Demo calculator
- On the public website, no sign-up: load, transport and report in three steps, downloadable as PDF.
- Offsetting
- Catalogue of offset packages with CO2e offset and price.
- API and import
- APIs to create trips in bulk and calculate emissions, Excel and CSV import and export.
Funding
Project co-funded by the ERDF Regional Programme Liguria 2021-2027, Action 1.3.7 “Modernisation of the freight logistics system”.

Need to report the emissions of your transport?
Next case
Phytosanitary treatments · Port
PQS